Monday, 30 April 2018

Run Time/Replay Settings - Load Runner - Part_1 - Chapter10


  • Run time Settings are an important configurations, which should be adjusted according to our needs.
  • Run time Settings are divided into four parts.
    • General
    • Browser
    • Network
    • Internet Protocol
    • Data Format Extension:

  • All the above cannot be explained in a single post as they will have sub sections. Hence we will segregate as different parts.
    • General:
      • Number of iterations can be configured.
      • Run time order can be configured. i.e Action blocks can be re-arranged according to our needs.
    • Pacing: 
      • Pacing is an important topic that needs attentions. As of now will explain in general what is pacing and its standard options available. Later on another post, will explain in details about pacing.
      • Pacing is a time different between every iteration.
      • Three basic options available in Load Runner as below
        • Start new iteration as soon as the previous iteration ends: This option can be selection if NO pacing is required. 
        • Start new iteration after the previous iterations ends, with Fixed/Random delay of 60.00 second(s) : This option can be selected to enable pacing with specifying time in seconds, so that, the next iteration would wait till the specified threshold reaches and then starts new iteration.
        • Start new iteration at Fixed/Random intervals, every 60.00 seconds(s): This option can be selected, if at any cost, the new iteration should be started with fixed or random time specified. i.e if kept 10 seconds as interval time, then for sure after 10 sec, the new iteration would be initiated, not waiting for the previous iteration to complete.
    • Log:  
      • Log is actually a trace.
      • Enabling logging checkbox enables log.
      • There are two options available for logging.
        • Log Options:
          • "Always option", enables log every time, you replay the script.
          • "Log when error occurs and limit" : Log messages would be printed in replay log, if log size reached the specified threshold.
        • Detail Level:
          • Standard Log: if enabled, it will print what is the transactions called, and what is the status of the requests, whether it passed or not. 
          • Extended Log: if enabled, it will print below details informations
            • Parameters values subtitued
            • Data returned by server. i.e server response for our web request. This helps us in correlations.(This will be explained later)
            • Advance trace will print indepth details of the communication happened between request from client and response from server.
    • Think Time: 
      • This is to emulate the user interaction time delay. For example. the user hits the url and types username and password and click login button. this would take some 20 to 30 sec approx. so we would keep 20 sec think time above the login transaction to emulate the real world scenario.
      • Four different options available as below
        • Ignore think time
        • Replay think time as recorded : This option enables the think time specified in our script.
        • Multiple recorded think time by 1 : hardly we will use this.
        • Use random think time: Approximate average think time can be configured.
  • The remaining setting would be explained in different posts.
  • Stay tuned for more learning's.

Wednesday, 25 April 2018

Recording Options - Load Runner - Chapter9


  • Recording options can be opened via two different ways as below.
    • Vugen --> Record--> Recording Options
    • Vugen --> Recording icon -->Recording Options link
  • Recording options has different settings that can be chosen before starting recording as below:
    • General -->Recording: 
      • HTML-based script: Is the generic mode of recording, which would capture requests, when your does any clicks. HTML would have less correlations compared to URL Mode.(Will explain this on upcoming posts). HTML mode captures all the non-html resources like(.css, .jpg, .png etc) in a combined requests of web_url.
      • URL- based script: It is bit in-depth level of recording compared to HTML mode. URL mode captured all the requests going from browser to server and separate each and every components into separate requests under web_custom_request. i.e .css, .jpg, .png would also be called separately with separate web_custom_request. Mostly URL mode recording options are chosen for handling java-script calls, in-depth functional flows.
      • When application is not getting recorded in HTML mode, we can try with URL mode recording, When application is not getting recorded in URL mode, we can try with HTML mode respectively.
      • Script --> Script
        • Additional settings that may help. You can check/Uncheck whatever is useful according to your need.
      • Protocol --> Protocol
        • Selected protocol name would be listed here.
      • Code Generation --> Code Generation
        • This is an important recording options, that needs attention. Both the check boxes should be selected. This helps in identifying dynamic values in our script, which is nothing but auto-correlation.(Will explain this in upcoming posts.)
    • Correlation:
      • Configuration --> Scan for correlations. Select all check boxes for enabling auto correlation.
      • Rules --> Configuring auto correlation rules. (Will explain this in upcoming posts for better understanding)
    • HTTP Properties:
      • Preferences: 
        • Enable checkbox "Generate web_reg_find functions for page titles". This helps for page validation. Which confirms other whether the expected web page is loaded or not.
        • Check/Uncheck others based on your need.
      • Proxy Recording Options:
        • This has been explained in earlier post "How to handle recording issues.".
        • Check/Uncheck the option "Use the LoadRunner Proxy to record a local application" to make the VUGEN record the events/requests. This helps in resolving recording issues.
    • Network:
      • Mapping and Filtering:
        • Port Mapping --> Capture Level
          • Socket Level data: This is the generic level of recording people use. If Socket level is selected before recording, it calls up SOCKET API which was built by HP Load Runner team to that provides access to internet.
          • WinInet Level data: This is another level of recording, which calls up WININET(Windows Internet) API which was created by Microsoft team to provide access to internet.
          • Socket and WinInet : It is the combination level of recording mode.
          • The advisable way is, first we need to try with Socket Level, if the application were not recorded, then we need to select WinInet level and then finally we can try with both the application together.
          • Advanced Port Mapping settings: This is an addition option can be configured if you aware of SSL details. (this is bit advanced which can be learnt later).
    • Data Format Extension:
        • Chain Configuration: Transforms GWT data to XML format(this is bit advanced which can be learnt later)
        • Code Generation: This option can be enabled if the code generation is log is not readable. (this is bit advanced which can be learnt later)

How to Handle Recording Issues - Load Runner - Chapter8


  • While trying to record any application, you may face many recording issues as below:
    • Issue 1: Application will not launch while recording, the page will get loaded with some error messages like below 
      • Error 1:"Page Not Found"
      • Error 2: "Internet Explorer cannot display the webpage"
      • Error 3: "Web page cannot be found"
      • Error 4: "Forbidden" etc.
      • Error 5: "Proxy Error"
    • Issue 2: Application will be launched and you may be able to navigate while recording, but no recording events would be captured and at the end of recording, the script generated would not have any web requests captured it.
    • Issue 3: While recording, browser will get closed abruptly or unexpectedly.
    • Issue 4: Missing requests in the generated script.
  • Resolution for Issue 1: 
    • If you face Error 1 to Error 4: You need to try changing the recording options in recording dialog box. I will explain this in another post (Recording Options - Load Runner).
    • If you face Error 5 : Once browser opens up during recording, go to IE Settings-->Internet options -->Connections Tap -->Lan Settings --> Check 1st two check box of proxy settings and provide proxy URL -->Click OK--> Click OK and Refresh. Then the events would start capturing.
  • Resolution for Issue 2:
    • For this issue, you need to change one recording options in recording settings as below. VUGEN-->Record menu --> Recording Options --> HTTP Properties --> Proxy Recording settings --> check first checkbox "Use the Load Runner Proxy to record a local application" and try recording once. If still issue persist, try un-checking it and try once again. The events will get captured.
    • If the above doesn't helped, you need to change the browser in the beginning of the recording and try.
    • If still issue persist, Try recording from different machine.
  • Resolution for Issue 3: To overcome this issue, either you need to re-install IE or you need to record from different browser or different machine only.
  • Resolution for Issue 4: If requests are missing in the newly generated script, then you need to record using FIDDLER tool instead of VUGEN.
  • Stay Tuned for more learning. :-)


Tuesday, 24 April 2018

How to Record Sample Application - Using Load Runner - Chapter7


  • Once Virtual User Generator(VUGEN) is launched, follow below snapshot.
    • File --> New Create And Solution.
    • Protocol Selection --> Type of protocol in which application is developed.
    • Script Name --> Any user defined name
    • Create --> Click Create button to proceed further.


  • Once clicked "Create" button as mentioned in above screenshot, follow below snapshot to initiate recording.
    • Click Recording Icon
    • Pass on URL to record. Probably Sample application(Web Tours) URL.(http://127.0.0.1:1080/WebTours/index.htm).
    • Change browser if required by selection "Application" drop down.
    • Click Start Recording.


  • Once clicked "Start Recording" button as mentioned in above screenshot, a New browser opens up with the Web tours sample application and the respective Recording tool bar will capture all the events going from browser to server.


  • Navigate the application using credentials provided in the earlier post. 
    • i.e. username: jojo & Password: bean.
  • Once the required navigation's are covered click on "Stop Recording" button on the recording tool bar shown below.
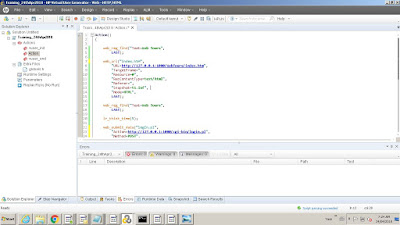
  • The requests or events captured will be converted to VUGEN script as below.


  • Stay Tuned to learn more. :-)

HP Sample Application - Load Runner - Chapter6


  • Once VUGEN is launched, we check sample application.
  • HP provides us a wonderful sample/testing application, which helps all the beginners a lot to grow more.
  • Go to Start Menu-->All programs-->HP Software--> HP Load Runner-->Samples
    • Under this, we will have options.
      • Start HP Web Tours Server
      • HP Web Tours Application.
    • First we need to click start server for enabling accessing sample application. To do that click on "Start HP Web Tours Server".
    • Some command prompt windows opens up. Dont close them, minimize them.
    • Then, we can click on "HP Web Tours Application" to launch sample application.
    • Login credentials to be used to access WebTours application as as follows
      • username: jojo
      • password: bean
    • Navigate certain flows and get familiarize with it.
  • Stay tuned for more leanings.


How to Launch Load Runner - Chapter5


  • Once Load Runner is installed, Load Runner short cut menu would be available in start menu as below.


  • If you further click on that shortcut menu--> All Programs--> HP Software, you will have sub folders as below:
  • HP Software --> HP Load Runner-->
    • Read Me
    • Virtual User Generator
    • Documentation
    • Samples
    • Tools
  • From the above list, if we click Virtual User Generator, VUGEN performance testing scripting tool will be launched.
  • Stay Tuned for more leanings.

Load Runner Free Version- Try Now - Chapter4


  • First we should have Load Runner Tool installed in our Computers/Laptops to start learning it.
  • It is a licensed and an heavy cost tool. Don't worry. HP provides trail version of Load runner with complete access to VUGEN, Controller & Analysis. Check the link Here. 
  • The only restriction is, you can do performance testing only up to 50 users.
  • The actual cost of licence is $0.56 per Virtual User a day. 
  • For Example if Facebook or Twitter wants to check that how their application will work for 10 lakh concurrent users, for example. then $0.56*1000000= $560000 dollars required for load runner license.
  • Stay tuned for more leanings.


Load Runner Components - Chapter3


Load Runner is basically divided into 3 components.
  • VUGEN : 
    • This is a component or a standalone tool which is used for creating performance testing scripts.
    • Creating Performance testing scripts are not so complex. Don't Worry.
    • In our real life,to record any song, we click record button and we start singing and then will stop. The result will would be a draft version of the song. Later we enhance by adding effects.
    • Similar way, VUGEN tool is built in a such a way, that it goes like, we need to provide application URL to record, and navigate the functional flow and stop recording will give draft version of Performance Testing Script. And then we need to customize according to our needs.
  • Controller/Performance Center:
    • Controller/Performance Center is a second component of load runner. Where, the customized performance test scripts are uploaded and we will design test scenario to do performance Testing.
    • Controller is actually a Standalone tool, whereas Performance Center is web based. But both does the same functionality.
  • Load Generators:
    • Load Generators are the third components. But in market it is not called as component, instead it is treated as an interface.
    • Load Generators are actually a Agents/Post Men/Supervisor.
    • Controller will take a copy of Performance Testing scripts and load into to slave machines via Load Generators.
    • Load Generators will monitor the script which is running in a slave machines, trace out logs and Statistics.
  • Analysis:
    • Analysis is the actual third component of load runner according to market.
    • Analysis is a reporting tool. It collects all the information from Load Generators and provide high level reports including graphical representations for convenient understanding.
  • Result:
    • Finally, collecting all the inputs/metrics from Analysis and a performance tester will create a customized report according to client's requirements or client's/customers understandable format.
  • Stay tuned for further easy learning. :-)


Monday, 23 April 2018

Different Types Of Testing Using Load Runner- Chapter2


  • Using HP Load Runner, we can able to do the following different types of Testing.
    • Functional Testing.
    • Functional Automation Testing.
    • Performance testing.
    • Performance Monitoring.
    • Performance Tuning.
    • Load Testing.
    • Endurance Testing.
    • Spike Testing.
    • Stress Testing.
    • Database testing.
    • Server Monitoring.

  • later we I will explain, that how to do all the above testing using Load Runner.
  • Stay Tuned.

Performance Testing Quick Look - Chapter1


  • Performance testing is quite different from Manual and Automation testing.
  • Performance testing would be quite interesting and has wider scope in the global market.
  • There are two varieties of Testing in the market. One is Functional  and another one is Non Functional, which are also called as NFR. Performance Testing comes under NFR.
  • Load Runner & JMETER are the major tools, which are used by Performance Testers all around the world.
  • Load Runner is Licensed, whereas JMeter is Opensource. 
  • Load Runner has communities to support on any hurdle situation, whereas for JMeter we dont have such communities.
  • Most of the MNC's use Load Runner to maintain quality and Some MNC's started migrating to JMeter as a cost cutting initiative.
  • According to me All the applications should be undergone Performance Testing before moving them to production. Which saves millions of dollars. 
  • Soon we will make you understand all the Performance Testing concepts in a very legible manner.
  • Stay Tuned. :-)


Correlation Using Load Runner - Part1 - Chapter13

Correlation General Description : Capturing Dynamic values from the preceding requests and substituting in the post request.  Exam...